
A new paper by the Platial Analysis Lab has been published in Health & Place. In Urban Mobility Responses to Wildfire Smoke-Related Air Quality Advisories in Montréal, Canada, the team asks a simple question with an uncomfortable answer: when public health agencies tell a city to stay indoors, does the city listen?
Summers of Smoke
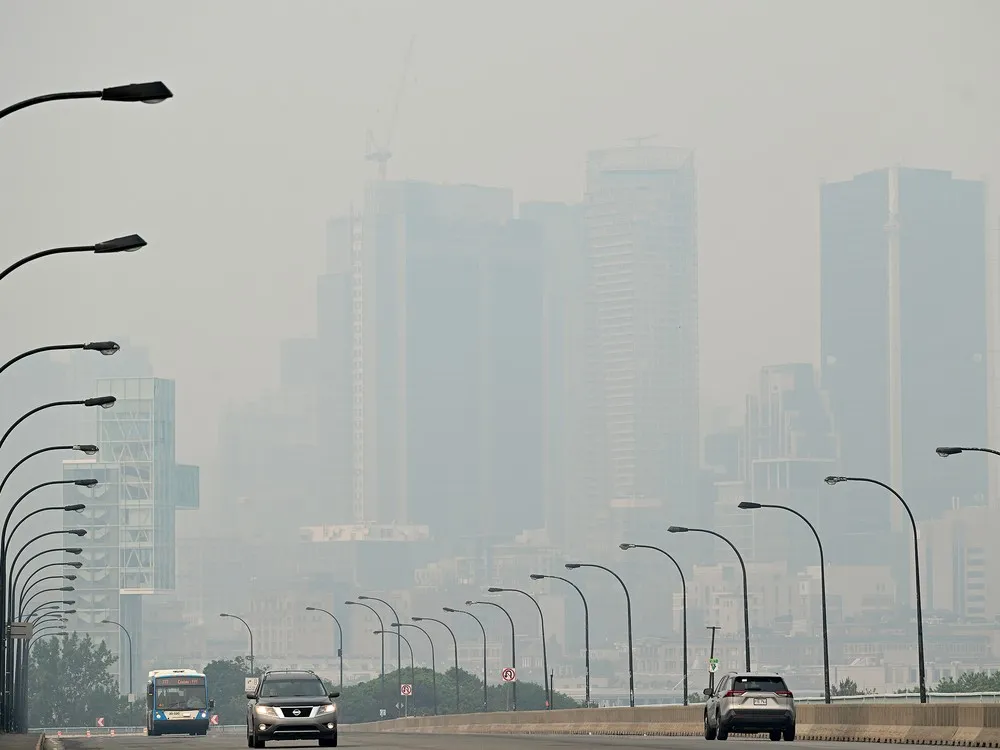
In June 2023, Montrealers woke up to a hazy sky. For several days the city held the unwelcome distinction of the worst air quality in the world. It happened again in 2025. Canada’s 2023 wildfire season was the worst in recorded history, with more than 17 million hectares burnt; 2025 followed as the second worst, with nearly 9 million.
The smoke from those fires travels, and it is dangerous. Exposure to wildfire smoke is linked to all-cause mortality, respiratory morbidity, and a range of other adverse outcomes, and there is evidence that pollution from a fire source is especially bad for respiratory health. One study attributes tens of thousands of deaths across North America and Europe to the 2023 Canadian fires alone. As wildfires grow more frequent under a warming climate, their smoke is becoming one of the costlier and more dangerous risks we face.
Faced with this, public agencies issue warnings, asking people, especially those vulnerable – children, older adults, those with respiratory or cardiovascular conditions – to limit their time outdoors. But do people actually follow these warnings?
Measuring Mobility Patterns
We assembled daily activity counts for four modes across the Island of Montréal, from May through September of 2022 to 2025: metro entries and bus boardings provided directly by the Société de transport de Montréal, trip records from the BIXI bike-share system, and recreational running activity from Strava.
Against these we set the advisories themselves, provided by Environment and Climate Change Canada (ECCC), covering 27 advisory days. We used time-series forecasting to model each mode, learning the ordinary shape of travel in Montréal, and then producing a counterfactual: what a specific day should have looked like had no advisory been issued. The gap between that prediction and what actually happened is our estimate of the advisory’s effect.
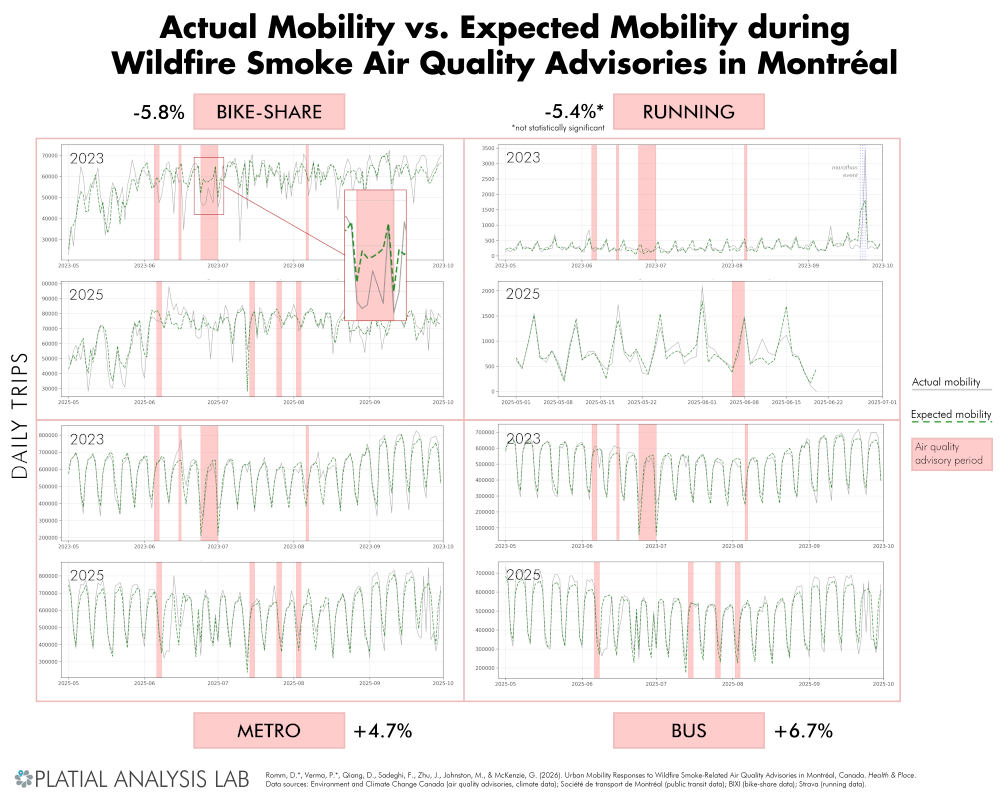
Actual daily metro ridership (grey) against expected ridership with no advisory in effect (green). Advisory periods are shaded in red.
What We Found
Three of the four modes moved, and they moved in opposite directions.
- Bike-share trips fell 5.8%: about 3,600 fewer BIXI trips on a typical advisory day.
- Bus ridership rose 6.7% and metro ridership rose 4.7%: roughly 30,000 and 25,000 additional trips per day, respectively.
- Recreational running did not change at all. The point estimate was negative, but nowhere near statistical significance.
We reran every model with daily fine particulate matter (PM2.5) readings added, to check whether we were simply detecting how bad the air was rather than the advisory itself. The pattern held, and if anything strengthened for transit: metro +5.9%, bus +8.4%, bike-share −6.0%.
While the direction of the change – from open-air modes to enclosed modes – is what a public health official might hope for, the magnitude of change is modest. What we can say is that the magnitude is modest. A 5.8% decline means that roughly 94 of every 100 expected bike trips still happened, on days when the horizon was invisible.
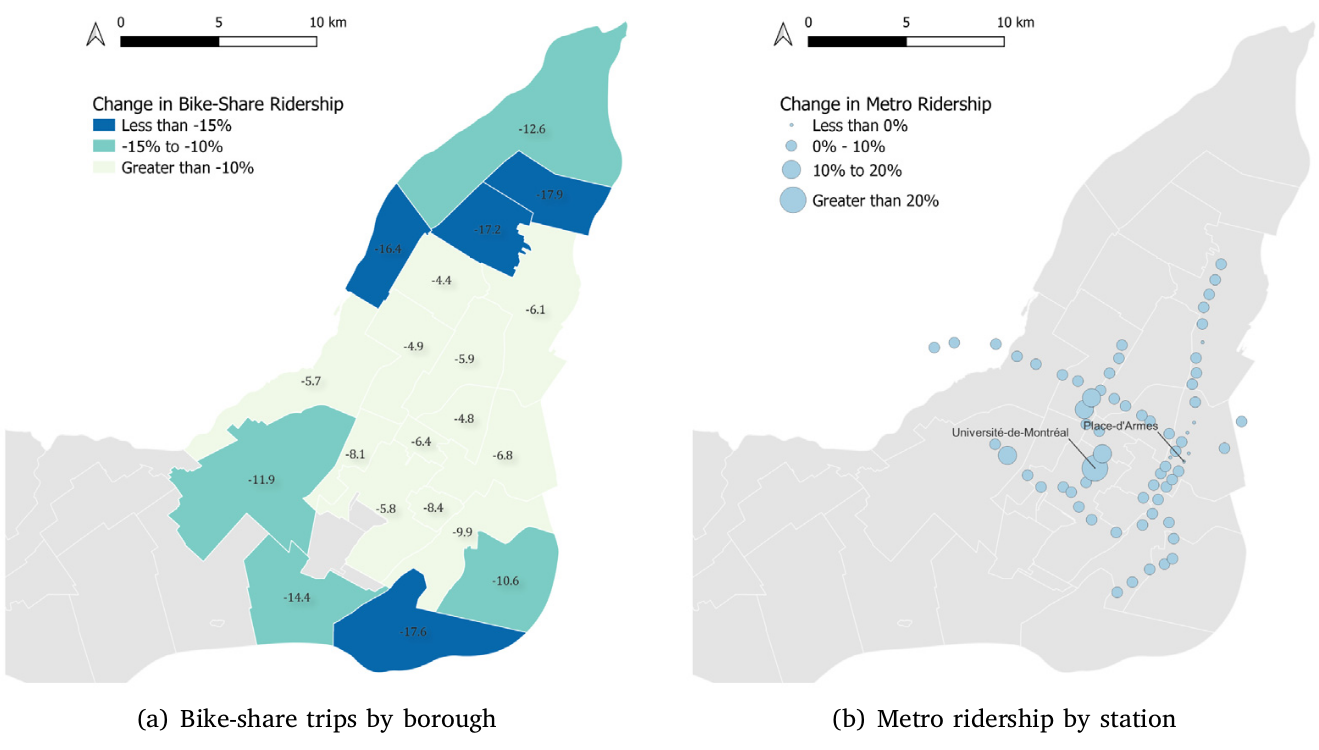
There were also spatial differences in the results. The steepest declines in cycling were not downtown but on the city’s edges, perhaps because trips in the outer boroughs skew recreational and therefore discretionary, while bike commute trips continue regardless of the sky.
The metro maps invert this. Most stations gained riders, but Place-d’Armes, in the heart of the downtown core, lost 6.2%. Meanwhile Université-de-Montréal gained 24.8%, the largest shift of any station in the system, with Édouard-Montpetit nearby up 15.1%. Two stations serving the same campus, both surging: perhaps students and staff who would ordinarily walk or cycle, choosing transit instead.
The null result on running was the one that surprised us most, since vigorous outdoor activity is especially warned against in the bulletins. However, this may be due to the skew in our running data sample (from Strava), which oversamples committed athletes, who may be less inclined to abandon their running plans. We were also able to control only for sanctioned races, not for the many informal run clubs and fun runs that fill a Montréal summer, and with far fewer daily activities than the transit datasets, that unmodelled noise weighs more heavily.
A Gap Between Warning and Action
Put together, we found only slight changes in mobility patterns, likely a long way from the response air quality advisories are written to produce. That accords with the broader literature on air quality alerts, where a systematic review of adherence found compliance with health advice generally low.
This suggests a need for improved communication strategies, public health campaigns, and perhaps concrete policies to support changes in travel behaviour: free or reduced transit fares on advisory days, or employer flexibility on remote work.
Montréal will have more smoky summers. The advisories are reaching people; what they are not yet doing is moving them.
Romm, D.*, Verma, P.*, Qiang, D., Sadeghi, F., Zhu, J., Johnston, M., & McKenzie, G. (2026). Urban mobility responses to wildfire smoke-related air quality advisories in Montréal, Canada. Health & Place. v101. September 2026. 103736. Elsevier
This research made use of data provided by Environment and Climate Change Canada, the Société de transport de Montréal, BIXI, and the Montréal Air Quality Monitoring Network.