
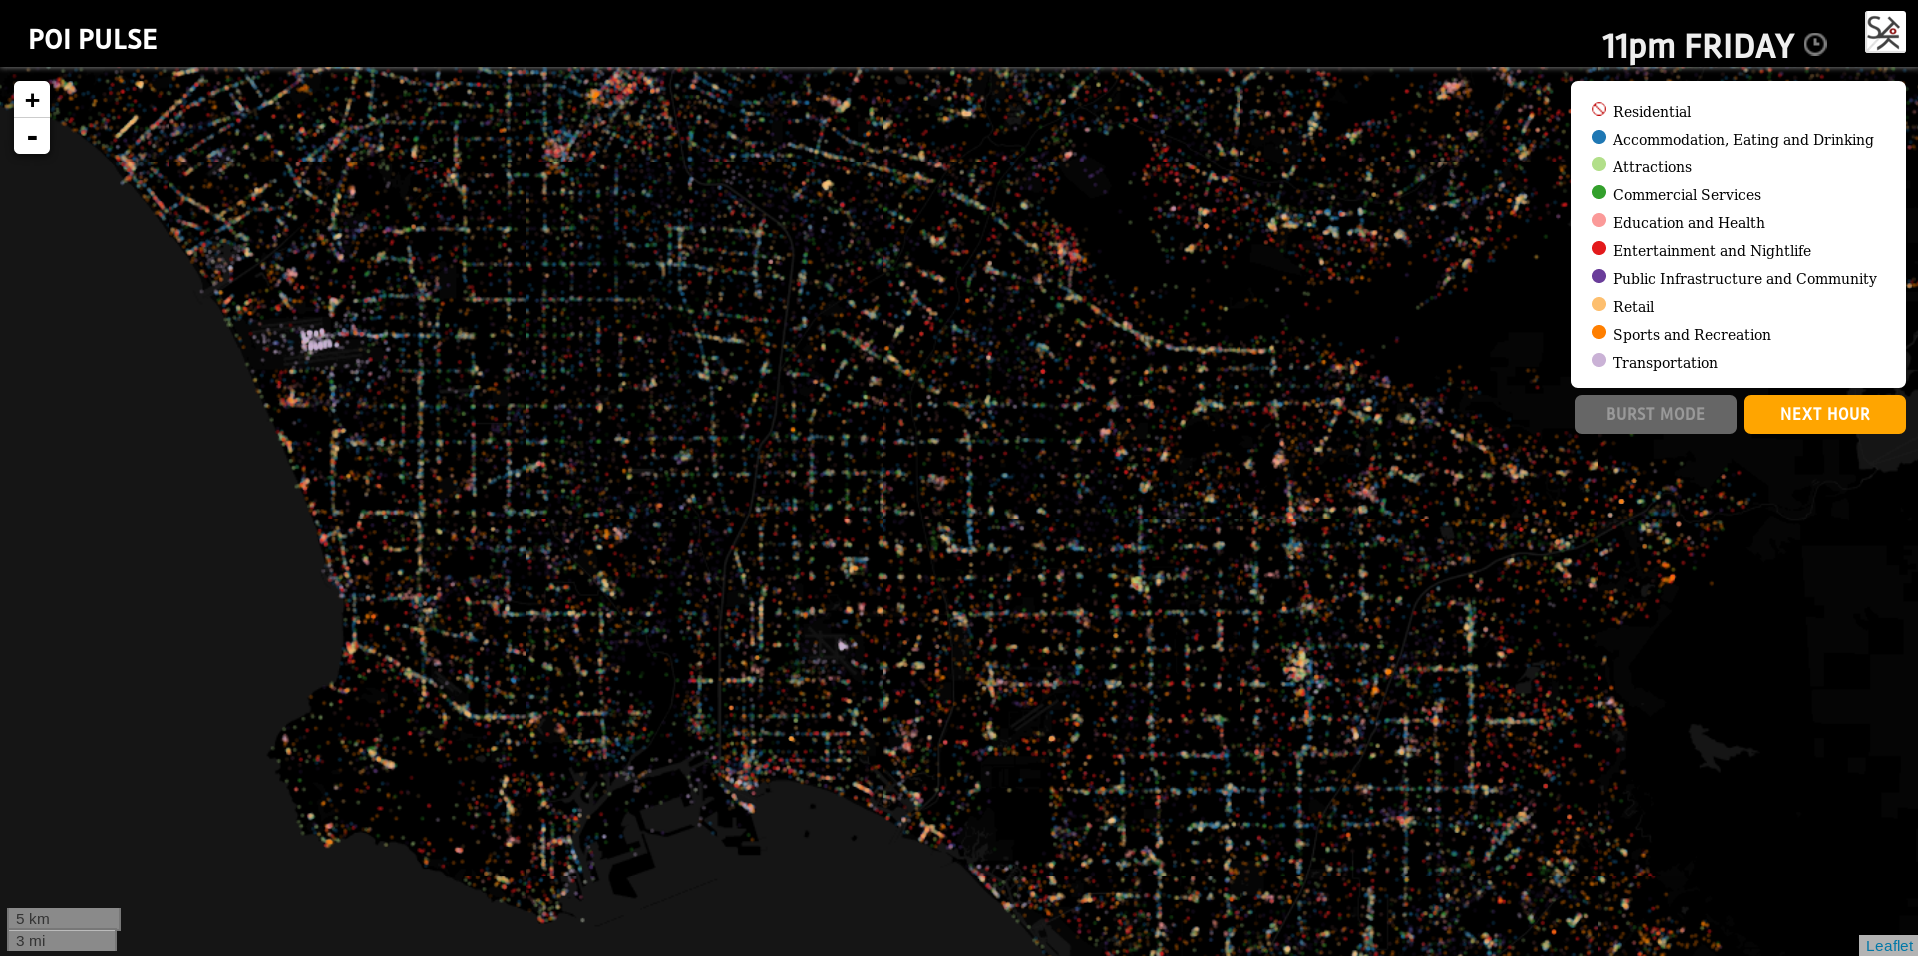
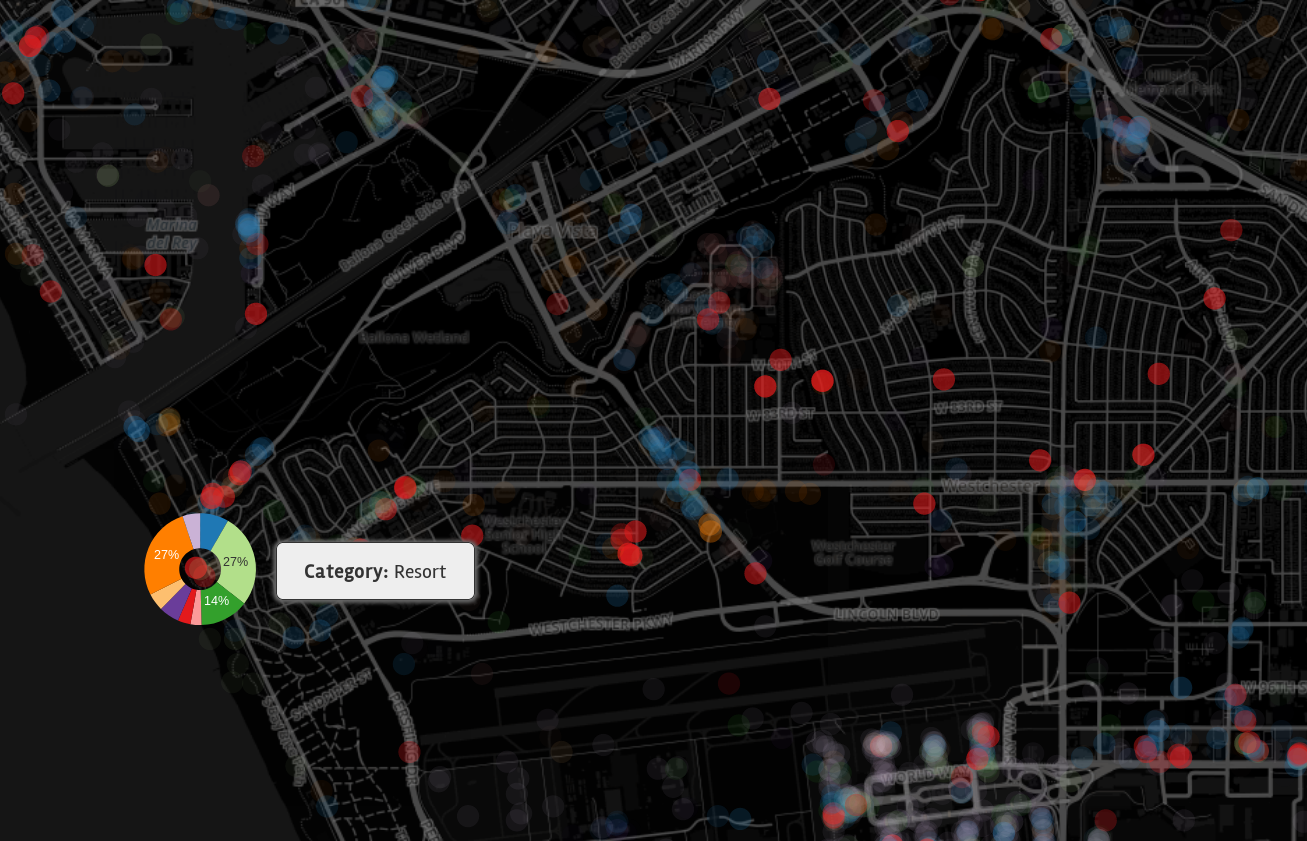
POI (Point of Interest) Pulse is an interactive application that shows the pulse of user behavior in the Greater Los Angeles area. Visualized through interaction with approximately 170,000 points of interest (e.g., Bars, Hospitals, Parks) rendered through over 12 million tiles, the map displays both typical activities patterns in the region as well as real-time social behavior.
Visit the POI Pulse web application
The volume, velocity, and variety of data that are now becoming available allow us to study urban environments based on human behaviour with a spatial, temporal, and thematic granularity that was not achievable until now. Such data-driven approaches open up additional, complementary perspectives on how urban systems function, especially if they are based on user-generated content (UGC). While the data sources, such as social media, introduce specific biases, they also open up new possibilities for scientists and the broader public. For instance, they provide answers to questions that previously could only be addressed by complex simulations or extensive human-participant surveys. Unfortunately, many of the required data sets are locked in data silos that are accessible only via restricted APIs. Even if these data could be fully accessed, their naïve processing and visualization would surpass the abilities of modern computer architectures. Finally, the established place schemata used to study urban spaces differ substantially from UGC-based point-of-interest (POI) schemata. At the Platial Analysis Lab, we explore a multi-granular, data-driven, and theory-informed approach that addresses the key issues outlined above by introducing a theoretical and technical framework to interactively explore the pulse of a city based on social media data.