
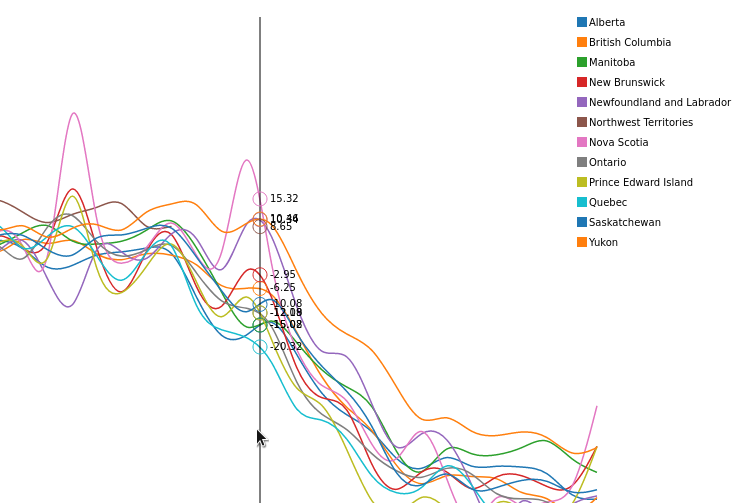
I (Grant) spent a bit of time over the past few days exploring Google’s Community Mobility Reports. Some very interesting data but also unfortunate that it is only published in PDF format. This morning I built a script (borrowing heavily from Amarang) to extract the data values from the PDF graphs. The result is the interactive D3 visualization available at the link below.
https://platial.science/covid19/