
Now that Jump‘s electric-assist bicycles have been on the streets of Montreal for one month, we thought we would write up a short blog post presenting some of the spatial and temporal patterns that we have observed in Jump’s user activity. After a bit of a rough start (at least from the city’s perspective) we have not heard much on how well the pilot program is going, nor any details related to adoption rates, etc.
For this work, we accessed public “available bikes” data that is published via Jump Montreal. Accessing these data at a regular frequency for exactly 4 weeks, we are able to identify trips as those where a bike appeared available at one spatiotemporal location and then reappeared as available at a different location some time later. A few other “data cleaning” methods were employed to ensure that only authentic user trips were identified, and not GPS multipathing errors or staff re-distribution trips. See a full description of the methodology used here.
By the numbers*
*These are not official statistics as reported by Uber/Jump, but rather as identified by analysis of available bikes.
- Total Trips: 27,812
- Mean number of trips per day: 927 (median: 893)
- Most popular days of the week: Wednesdays & Thursdays
- Mean number of bikes in use per day: 242 (median: 237)
- Mean trip duration: 21 minutes (median: 15 mins)
- Mean trip distance (on road network): 2.5 kilometers (median: 2.0 km)
Spatial Patterns
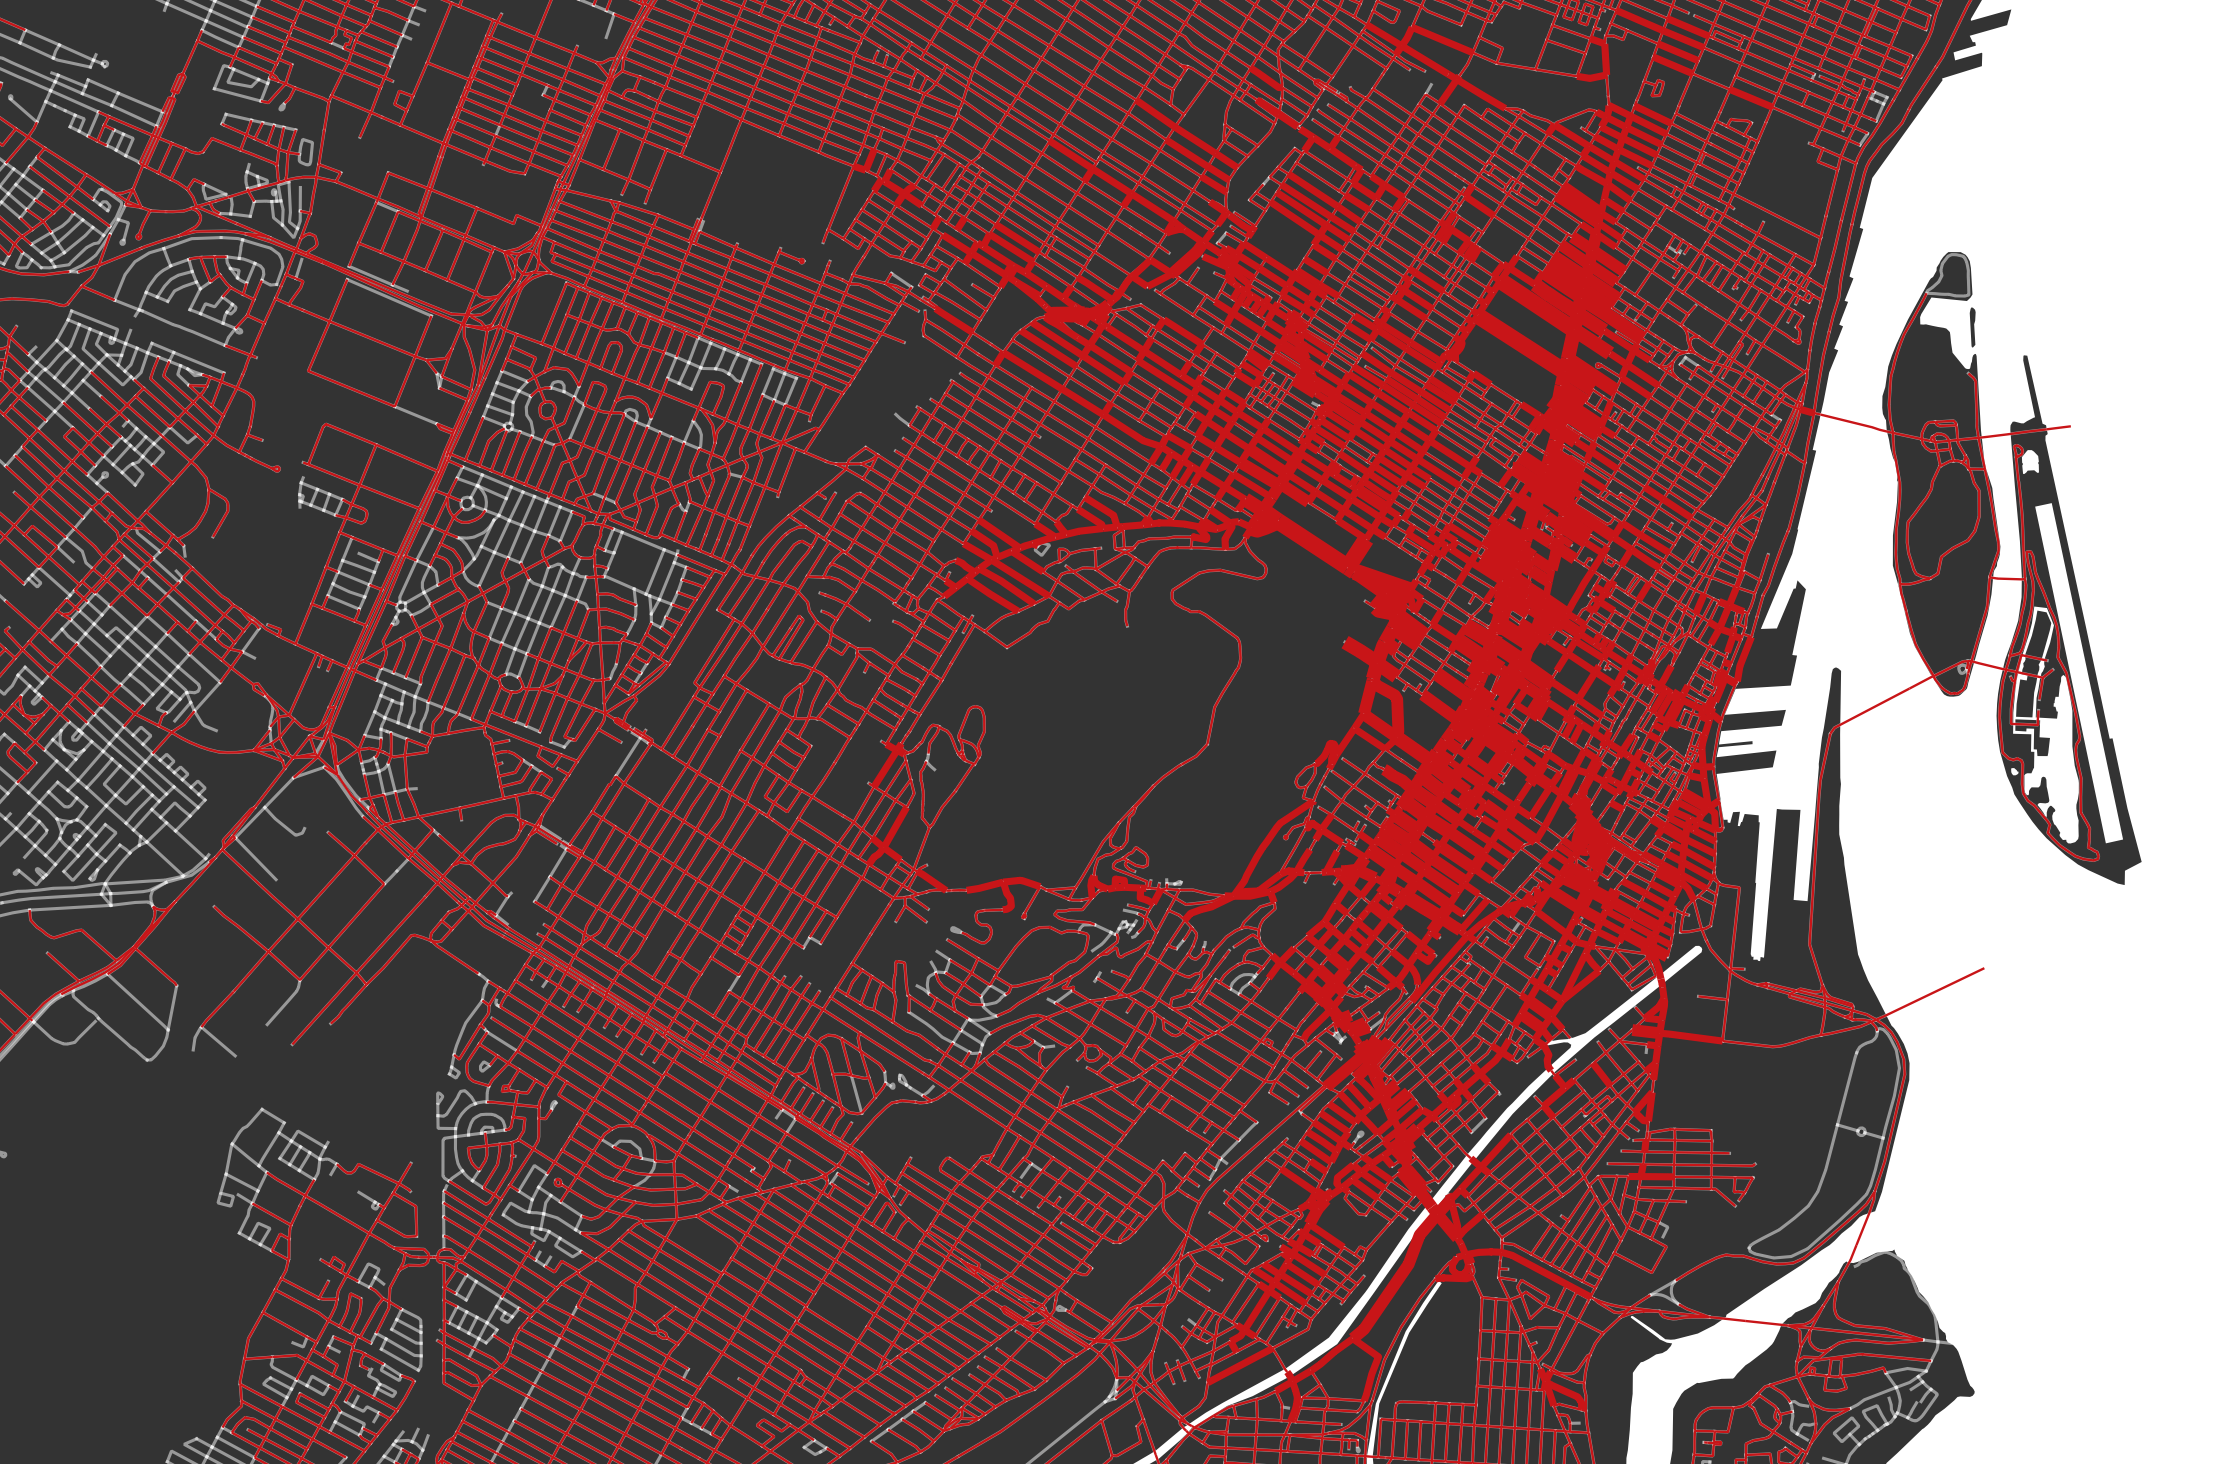
Snapping trip origin and destinations to the existing Montreal street network allowed us to estimate the route taken on each trip. This was calculated using Dijkstra’s Shortest Path First algorithm. Importantly, this approach assumes that each user took the shortest possible path. While we know this is likely not the case, this approach is reasonable given the resolution of data and the general spatial trends we are investigating. The Figure below shows the density of trips on each road in Montreal with the width of the street indicating the popularity of the road segment.
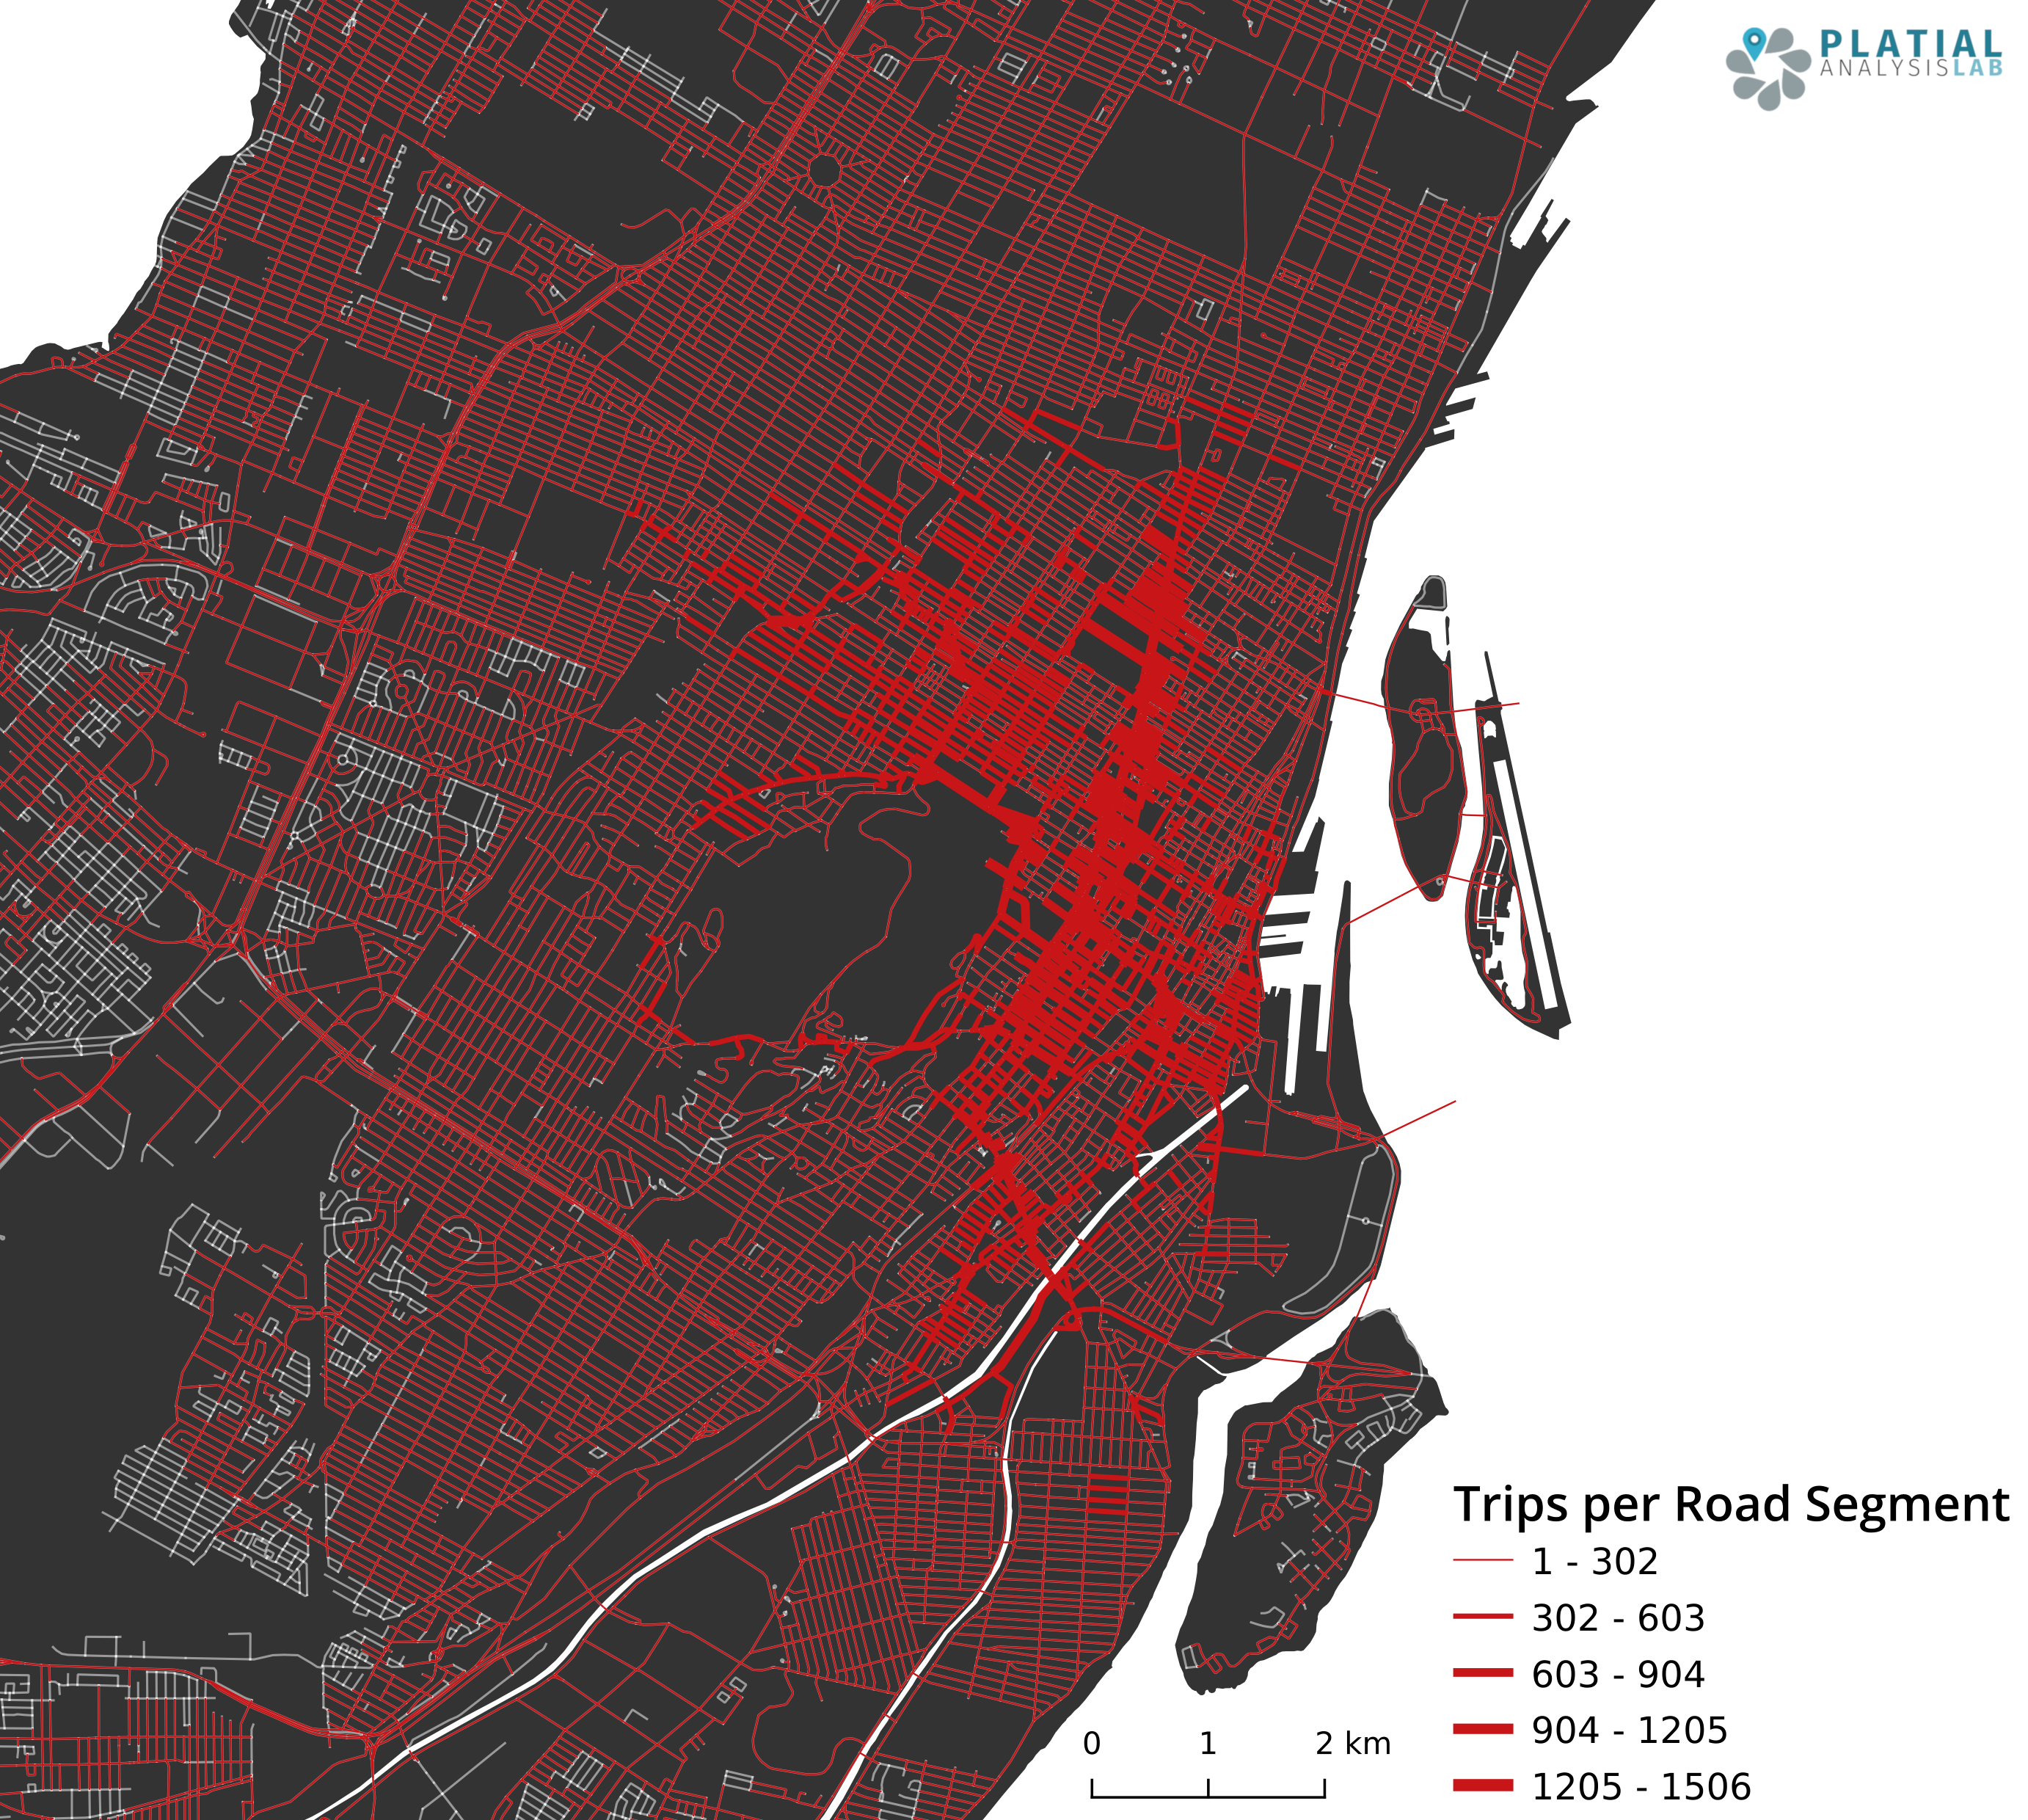
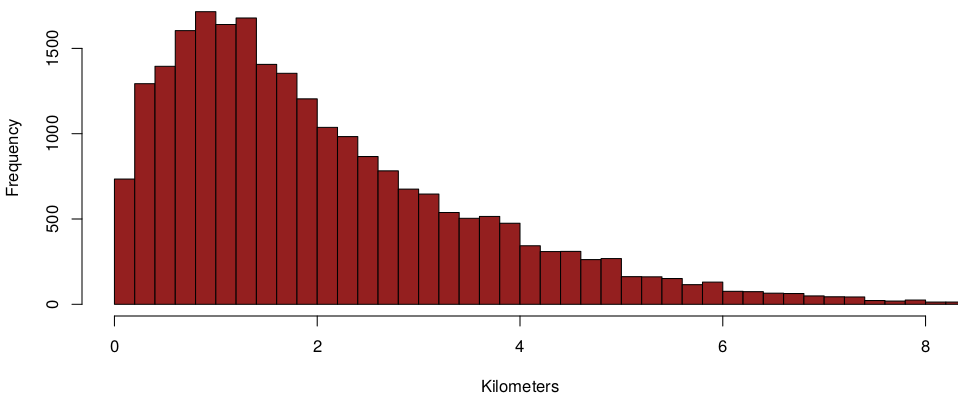
Notably here, the vast majority of trips originated or completed in the downtown core of the city with a limited number of trips taking place well outside of the authorized Jump operating region. Next, we generated a histogram to explore the distribution of trips by distance. This shows a standard long tail distribution you might expect of such data. Again, these distances were calculated as network distance along the Montreal road network (as opposed to as the crow flies). As stated above, the mean trip distance was 2.5 km with a median distance of 2.0km and a standard deviation of 1.8km.
Temporal Patterns
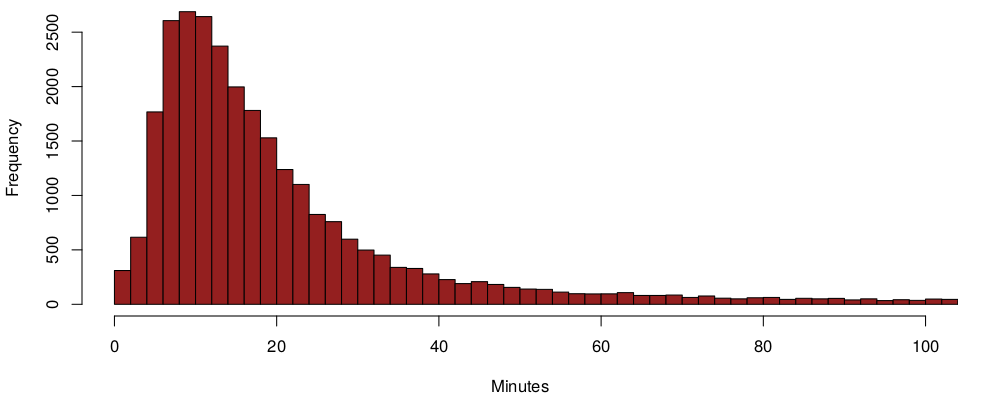
Next, we explored the temporal components of the trips. The figure below shows the distribution of trips by length of trip, again, a typical long tail distribution with the majority of trips taking less than 20 minutes. Notably, only those trips that took less than 2 hours were included in this analysis.
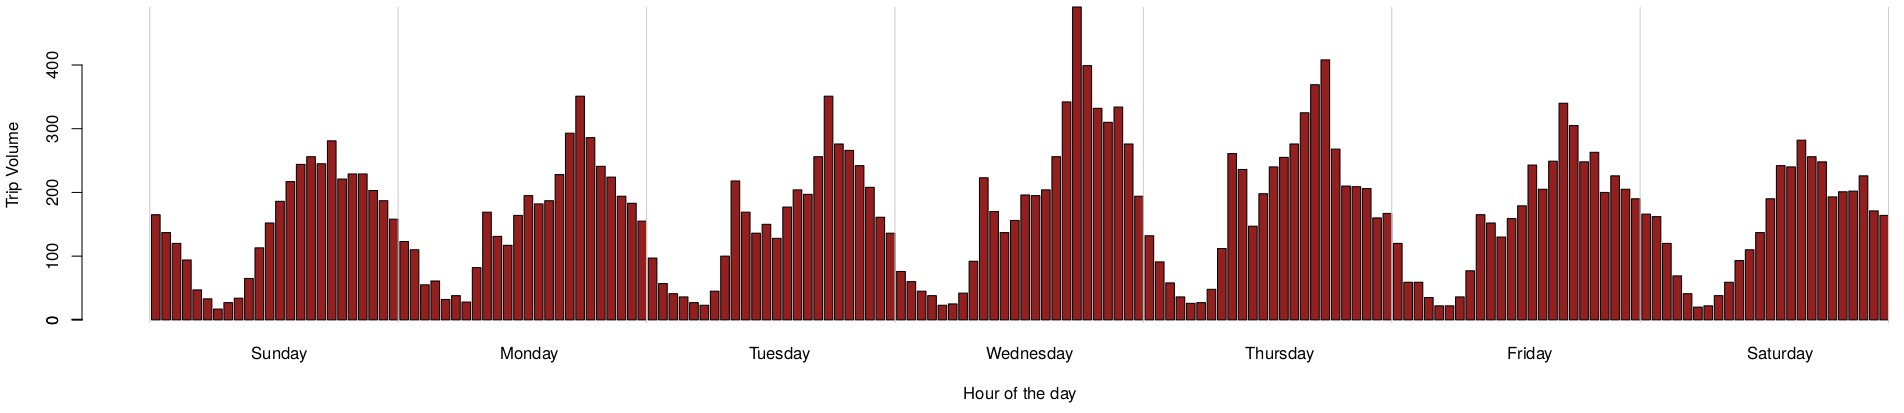
Finally, we investigated the hourly Jump usage in Montreal aggregated to a one week period. The figure below shows the hourly pattern. We see very pronounced peaks around 5pm on weekdays, one of two typical popular commute times. Interestingly, we don’t see that same peak in the morning, around 8-9am, a peak that is quite common in automobile and BIXI commuting behaviour. This suggests that commuters prefer an alternative mode of travel for the trip to work (e.g., Metro) but are happy to try out a Jump on the way home (perhaps less urgency to get home).
From a weekly perspective, Saturdays and Sundays don’t show the highest usage (as is often seen in other shared-mobility systems such as Lime Scooters), and also do not show a 9a/5p commuting pattern, which is not surprising. What is surprising, however is that both Wednesday and Thursday show the highest number of trips. We shouldn’t read too much into it at this point though as this could be due to a number of factors such as summer holidays, launch date of Jump, and weather in Montreal.
In summary, Jump is an interesting new mode of shared mobility for the city of Montreal and one that appears to have, at least partially, been adopted by Montrealers. There is plenty of analysis to do and we look forward to continuing this analysis through a SSHRC-funded shared-mobility project. In addition, we hope to work with the City and Uber to share additional analysis with the purpose of having an open and informed dialog on shared mobility in Montreal and Canada.
Press
A few news pieces to result from this analysis:
-
CBC News (Article): Montrealers are trying Uber’s new bikeshare program, but it hasn’t got the jump on Bixi
- CityNews Montreal (TV): Uber’s e-bike not affecting Bixi’s business [video]
- CBC News (TV): Jump Bike usage in the first month [video]